

There are two “efficiency curves” that are relevant to playing time and role. One of them is how a player’s performance varies based on how much he’s put in. The other is how his performance varies based on how much he’s asked to do.
At the one extreme, it’s hard to be effective playing every 10th point. At the other, too much play leads to fatigue or pacing and a similar decrease in effectiveness. You want your team to be at a sweet spot where your stars play as much as they can without losing effectiveness while getting your role players enough time to be effective, while maintaining the flexibility to ride one or the other a little more due to a hot or cold hand or an injury.
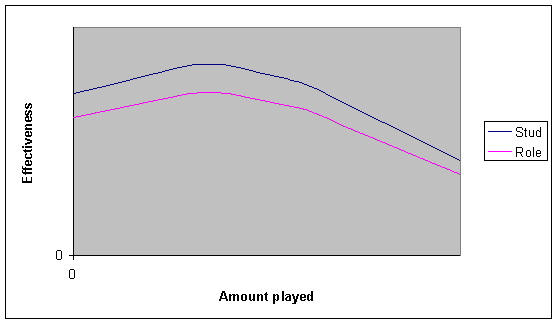
The first graph shows what I’m guessing a typical curve is for a stud and a role player, and a replacement player. (You can think of the x axis as either “readiness” or “points played”.) I think the shape of the curve is about the same for everyone, with the exception that well-conditioned athletes won’t drop off as quickly with lots of play.
So, the question for subbers is, can you incorporate this model into your subbing scheme? How much does a player have to play in order to be near his peak effectiveness? How much is too much before you start to see fatigue-related errors? Have you experimented with designating some role players to “on” one game (maybe they’ll play 8 points) and “off” the next (0-2 points) instead of being half-on (5 points) for both? Do players rebel against this?
The other curve shows how a player can bear a load when he’s in. On offense, if a player’s full job was to cut for goals, he’d be more effective than if he also had to work the disc. On defense, a player might be able to prevent the third handler from doing a lot, but would be toasted by the star cutter.
A good role player will actually be better than the stud at the subordinate tasks like filling or clearing or reacting to the poach, but the reason that the stud is the stud is that he will be effective when it’s his job to be the first cutter or to break the mark or to cover the top cutter.
Anyway, I’m not really sure what you’re supposed to do with this, but I’ve been thinking about it and wanted to write it up, so there.
8 comments:
uh, what are the units?
Luke - I'm not sure there are units. This is more like the framework and hypothesis based on statistical research no one would want to take on.
That said, I there are a few things to do with this. Subbing is a difficult job; in fact, we (6TM) believe that riding our stars too hard before the semi's last year contributed to us fading at the end when our opponent got hot.
I can think of two times when it's important to use this: when actually running subs at events that are long enough to tax a team's depth; when creating the team and populating it with the people who will have to fill these roles.
I'm stuck on the second piece right now, as we consider expanding our roster somewhat. Once you get over 3:1 or so for players, you need every role player to be able to step up when called upon so the stars are ready on Sunday, and you need everyone to be bought into the system. In other words, when even distribution of points means people would play 4-5 points per game, you know a) someone's not playing at all, and b) you better understand and be able to manage these efficiency curves over the course of a game and a tourney.
Sorry for the long comment.
The y-axis is something like "value" or "efficiency" or "effectiveness." Offensively, it would be some combo of passes, yards, goals, breaks, bailouts, great catches, timely foul calls, picks avoided, turnovers, etc.
For the first graph, the x-axis is something like "readiness to play." At the far left, you have a guy who is called in for his first point at 15-14. At the far right is the guy who has played every point of the game. In the sweet spot, where the curve is flat, you have the guy who has played enough to be loose and to have a feel for the flow of the game but not so much that he's going to be sucking wind if it's a long point.
For the second graph, the y-axis is how well you do a particular task. The x-axis can be how important or central that task is to the team (cutting is more important than clearing) or it can be how much of the offense or defense depends on that guy. Some players will handle supporting roles superbly but will wilt if installed as The Man, whereas others might do decently no matter what assignment you give them.
I didn't put units on these graphs because there is really no way to measure them, even if you had stats. But you can visualize or internalize what it means to be ready and in a groove, or to be out of it.
I'm not sure it matters, but I don't agree with the shape of the curves. First, I think that for most Studs the effective rate is lower than you have it with low play time (but hopefully still higher than for Roles). That is, I think many Studs need to "get into the rythym" of the game, and won't make the same type of impact with 2 points per game. I agree that the effective rate will modestly peak, flatten out and decline with fatigue.
For Roles, I think there will be considerable variation in the shape of the curve. For instance, there are some Roles who can play two ppg and play as well as they would if they played 15 (arguably half of the points in a close game). Other Roles will only be effective if they see the field 6-8 ppg.
This may be a factor in whether any individual Role can be useful to a club team. That is, if Role A is at X productivity with 2 ppg and Role B is at X-1 with 2 ppg, but at X+1 at 6 ppg, which player would you rather have at the end of your bench? Or the middle? How best can you create a substitution pattern that maximizes this utility.
Well, I'm kinda guessing at the shape and steepness of the curves.
For the Roles who do well at 2 ppg, what is it about them that lets them do so, and is that something they could teach everyone else, or is it just in their mental or physical constitution?
For the record, here are the numbers for the first curve. For instance, someone playing 20% of the points will play at 95% of his max efficiency:
% PT % Eff
0 85%
10 90%
20 95%
30 100%
40 100%
50 95%
60 90%
70 80%
80 70%
90 60%
100 50%
I would say that part of what makes some "roles" effective at 2 PPG is their mental and physical approach to things. But it's also the nature of someone's role. If you have a very simple job (e.g, play middle cup, then only cut for scores off a turn, or just stay out of the way) then you don't need to develop the same feel for the game that someone with a larger role would in order to do that job.
Even beyond the "stud" vs. "role" dichotomy, I think that the shape of the effectiveness vs. amount played curve is also influenced by the role you play. I know I can play a lot more points if I am playing dump then if I am cutting.
i thought i posted to this.
1) i was kidding about the units. but it did remind me of a company meeting we had a few years ago where they showed a similar graph... time accross the bottom, profitabillity across the top... but no units/scale. so no meaning. see, they didn't want those of us with a brain to really know the company's profitabillity, or else we would have used that knowledge in salary negotiations...
3) ringo got a computer?
2) skip 2
Post a Comment