Well, you gotta rank Boston ahead of Sockeye since Boston is 1-0 head-to-head.
Of course, I don't mean that. A team will play 30-50 games over the course of a year (more when you count the split squad teams they send to some spring tournaments), but some just want to take the results of 3, 2, or even 1 of all those games as the primary determinant of which of two teams deserves a higher seed. It's particularly silly in this example because it was a one-point pool play defeat in a tournament that Sockeye won (while Boston lost in quarters), a tournament that had 9 of the Nationals qualifiers plus Revolver and the Buzz Bullets.
Anyway, as promised, here are my seedings. I wrote a post last year about the method. The only change this year was to give bonus points also for making the semis at a top tournament like ECC or Boston Invite.
The method is to take a team's tournament RRI as shows up in the Score Reporter, give bonus points for finishing high, take a weighted average (with bigger tournaments counting as more), add bonus points for last year, and regress them to a low-Nationals-team level if they don't have enough tournaments this year.
One big problem I can't figure out is how much credit to give Jam for last year. Qualitatively, a team gets credit for both how they did and for how their Regional equivalent did, so Jam would get some credit since they won the Regional and the top finisher from the NW won Nationals, plus they're from the NW, which always seems to be worth extra points. They have the second highest rating prior to the bonus points, but three teams would jump ahead of them if they got no points.
So, without further ado, here are the results:
Team w/2006 No 2006 RRI
Sockeye 1 1 1
Bravo 2 4 4
Furious 3 11 7
SubZero 4 3 3
Jam 5 2 2
Ring 6 5 5
Boston 7 7 9
Condors 8 6 6
Chain 9 10 10
GOAT 10 9 8
Rhino 11 12 12
DWide 12 8 11
TStop 13 13 13
Machine 14 14 14
VBB 15 15 15
Pike 16 16 16
Comments:
1. Furious is an interesting case. RRI by itself has them 7th, but they drop to 11th because they didn't do well in elimination games (other than Can Nats; they lost in Sectionals and came in 3rd in region). But then the bonus for last year lets them leapfrog all those teams.
2. Otherwise, there is a disappointing lack of difference from straight RRI, whose main flaw in seeding is that it overvalues close losses. It's a predictive algorithm, so it is more accurate looking forward, but doesn't properly give credit for wins and losses. I may have discussed this already, but compare Boston and GOAT at CUT and Boston Invite. GOAT has a higher RRI at CUT than Boston, even though Boston beat GOAT twice and won the tournament. Similarly, GOAT won Boston Invite and beat Boston but had only a small advantage in RRI. In both cases, the tournament winner happened to have some close games along the way while the other team had bigger victories in the other games. I think this is probably where the algorithm is most off from how I would seed teams (and it was designed to mimic that method). Two of the Regional runnerups (Chain and Condors) had higher RRIs than the champ.
3. Most teams were pretty consistent, even comparing tournaments like Sectionals and ECC. "Inconsistent" Boston actually had the 4th lowest variance, but perhaps their inconsistency is manifested within a tournament rather than from tournament to tournament. The VBB had the second highest variance, but that is due to one significantly higher performance. That touranemnt? Nope, it was Sectionals, which was more than 200 points (equivalent to a 15-11 win) higher than any other tournament.
4. Sub Zero was surprisingly high. They were helped out a lot by their dominance at Regionals, which was the highest RRI for any team at any tournament this year (2954 including the 40 point bonus for winning).
I guess what I might want to do instead is to somehow figure out a strength of field for a tournament, allocate points based on final placement, then adjust for wins and losses during the tournament (so someone who wins while going undefeated would do better than one who wins while losing twice in pool play). Sounds doable.
The remaining issue I haven't addressed yet is how to handle inconsistencies. Sockeye emerges as #1 but lost their Region. They are so far ahead of Bravo that my solution is to bring Jam in front of them for the overall #1 and leave the others in the same order. DW and Chain are also inconsistent, but in this case, their average score is right in the middle of some other teams, so the final seedings by this algorithm are:
Jam
Sockeye
Johnny Bravo
Furious George
Sub Zero
Ring of Fire
Boston Ultimate
Condors
Doublewide
Chain Lightning
GOAT
Rhino
Truck Stop
Machine
The Van Buren Boys
Pike
Well, even I don't believe it, but once the method was set, there is no subjectivism. GOAT and Rhino seem low, but what higher team deserves the 11 and 12 seed?
Showing posts with label nerd. Show all posts
Showing posts with label nerd. Show all posts
Tuesday, October 09, 2007


Friday, October 05, 2007
formats
I was just checking out the other regions that had pools of 5 to see their schedules. Three of the Divs at South Regionals had 10 teams (5 per pool), and each had a different schedule. The one in the format manual is the one we used at Sectionals. Here it is:
4 v 5 2 v 3
1 v 3 2 v 4
1 v 5 3 v 4
1 v 4 2 v 5
1 v 2 3 v 5
Kinda sucks to be 3 in this format, opening with 2 and then 1. What is especially interesting is that finishing 2nd in the pool instead of 3rd can be quite beneficial, more than the difference between 1st and 2nd or 3rd and 4th. In a 5 team Masters Regionals, 1 and 2 play off for the 1st spot to Nationals while 3 plays 4, then there is a second game to go. Thus, if 1-3 are equal, the teams that finish top two have a 75% chance of advancing, while 3rd has a 50% chance. So, what might be the most pivotal game of the pool is played in the first round, then the next most pivotal games are in the 2nd round (not only 1v3 but also conceivably 2v4 if 4 is underseeded).
Speaking of opening with 2 and 1, I'm still a little ticked about the seeding and format at 1990 Nationals. We (Earth Atomizer, the little engine that could) had made Nats in 1989 ahead of Graffiti, had split with them during the year (and neither had won anything since NYNY and Boston #1 (let's see, they must have been First Time Gary that year, but let's just call them Titanic) were winning everything in the area), but they won the final game, and somehow they finagled the 3rd seed (or maybe it was because our seeding representative, Bruce Jacobson, was too nice). We were bummed because we wanted a shot at Titanic in the semis instead of NYNY, who always handled us. (As an aside, we played Titanic closer than Graffiti did, while they played NYNY closer than we did.) Anyhoo, it all went to seed until we dismantled Graffiti 19-9 in the game to go, but it was too late to play the 2/3 game, so we played it the following week and won, 21-17, to earn the #2 seed from the mighty NE. Titanic had lost by 1 in the semis at Nats in 1989, and were in year 4 of a 17 year streak of making semis. So, out of 12 teams, they seeded us....
9th. Just ahead of Titanic at 10th.
And our schedule had us playing the top seed LA in the first round, then 2nd seed (3rd overall) Windy City in the second (and final) round of the first day. Didn't seem fair. We got smoked by LA, 19-7 (this was the first year pool play games were to only 19 instead of 21), then lost a two-pointer to Windy City to end our tournament. We won our last three games after that so we could play the what-if game. We definitely would have benefitted from a different first day, but then again, maybe the next games wouldn't have gone the same way had we played them early. The Condors game in particular probably would have had a different tone. We got them on the last day after they had fallen apart. They went in seeded 3rd in the pool but played and acted badly, and actually kicked off one of their players (a captain, maybe? I hardly knew who anyone was back then, being only slightly older (25) than most of you reading this blog, and rsd did not exist yet).
Then again, it worked out ok for Titanic (better, actually). They opened with NYNY (and lost), but then got #2 seed Tsunami, who IIRC didn't have everyone there the first day because they knew they were just going to have two games they would win. Titanic won that won and made it to the finals.
Anyway, go DoG.
4 v 5 2 v 3
1 v 3 2 v 4
1 v 5 3 v 4
1 v 4 2 v 5
1 v 2 3 v 5
Kinda sucks to be 3 in this format, opening with 2 and then 1. What is especially interesting is that finishing 2nd in the pool instead of 3rd can be quite beneficial, more than the difference between 1st and 2nd or 3rd and 4th. In a 5 team Masters Regionals, 1 and 2 play off for the 1st spot to Nationals while 3 plays 4, then there is a second game to go. Thus, if 1-3 are equal, the teams that finish top two have a 75% chance of advancing, while 3rd has a 50% chance. So, what might be the most pivotal game of the pool is played in the first round, then the next most pivotal games are in the 2nd round (not only 1v3 but also conceivably 2v4 if 4 is underseeded).
Speaking of opening with 2 and 1, I'm still a little ticked about the seeding and format at 1990 Nationals. We (Earth Atomizer, the little engine that could) had made Nats in 1989 ahead of Graffiti, had split with them during the year (and neither had won anything since NYNY and Boston #1 (let's see, they must have been First Time Gary that year, but let's just call them Titanic) were winning everything in the area), but they won the final game, and somehow they finagled the 3rd seed (or maybe it was because our seeding representative, Bruce Jacobson, was too nice). We were bummed because we wanted a shot at Titanic in the semis instead of NYNY, who always handled us. (As an aside, we played Titanic closer than Graffiti did, while they played NYNY closer than we did.) Anyhoo, it all went to seed until we dismantled Graffiti 19-9 in the game to go, but it was too late to play the 2/3 game, so we played it the following week and won, 21-17, to earn the #2 seed from the mighty NE. Titanic had lost by 1 in the semis at Nats in 1989, and were in year 4 of a 17 year streak of making semis. So, out of 12 teams, they seeded us....
9th. Just ahead of Titanic at 10th.
And our schedule had us playing the top seed LA in the first round, then 2nd seed (3rd overall) Windy City in the second (and final) round of the first day. Didn't seem fair. We got smoked by LA, 19-7 (this was the first year pool play games were to only 19 instead of 21), then lost a two-pointer to Windy City to end our tournament. We won our last three games after that so we could play the what-if game. We definitely would have benefitted from a different first day, but then again, maybe the next games wouldn't have gone the same way had we played them early. The Condors game in particular probably would have had a different tone. We got them on the last day after they had fallen apart. They went in seeded 3rd in the pool but played and acted badly, and actually kicked off one of their players (a captain, maybe? I hardly knew who anyone was back then, being only slightly older (25) than most of you reading this blog, and rsd did not exist yet).
Then again, it worked out ok for Titanic (better, actually). They opened with NYNY (and lost), but then got #2 seed Tsunami, who IIRC didn't have everyone there the first day because they knew they were just going to have two games they would win. Titanic won that won and made it to the finals.
Anyway, go DoG.
Saturday, January 27, 2007
UCPC, Day 1
Ok, there's only one day, but it feels like a multi-day event.
First, I was surprised to find that there were several people who traveled great distances. Kudos to everyone who made it out. I'm sure it was worth your while.
As a presenter, I was sorry that I only got to attend two of the other presentations, neither of them by my ex-teammates, who were presenting at the same time. Each presenter gave his talk twice during the four sessions (14 presenters total, I think). Even the full-time attendees still then had to choose between presentations.
My talk (powerpoint here, one-page summary here ) went well, I thought. The two sessions had different feels to them. I incorporated some of the questions from the first session into the second, and as a result of that and other changes, I ran over on the second session after having 10-15 minutes in the first one just for questions. The second session went smoother as well, as I didn't have to fight over as many words, and knew when to just go ahead and leave one slide and start on the next.
I left before the panel discussion, as it was already after 5 pm and there was still a presentation going on in the auditorium.
Good job by George and Tiina assembling the myriad volunteers and vendors. You never would have known that this was the first of its kind by how well things seemed to go. Thanks to them.
First, I was surprised to find that there were several people who traveled great distances. Kudos to everyone who made it out. I'm sure it was worth your while.
As a presenter, I was sorry that I only got to attend two of the other presentations, neither of them by my ex-teammates, who were presenting at the same time. Each presenter gave his talk twice during the four sessions (14 presenters total, I think). Even the full-time attendees still then had to choose between presentations.
My talk (powerpoint here, one-page summary here ) went well, I thought. The two sessions had different feels to them. I incorporated some of the questions from the first session into the second, and as a result of that and other changes, I ran over on the second session after having 10-15 minutes in the first one just for questions. The second session went smoother as well, as I didn't have to fight over as many words, and knew when to just go ahead and leave one slide and start on the next.
I left before the panel discussion, as it was already after 5 pm and there was still a presentation going on in the auditorium.
Good job by George and Tiina assembling the myriad volunteers and vendors. You never would have known that this was the first of its kind by how well things seemed to go. Thanks to them.
Sunday, October 01, 2006
format question
An irate reader asks, yet again:
Can you ask some UPA type this question: "What other sport uses the UPAs 16.3.1
format?" ..you know, the one in which you have to beat everyone twice. I all
tried to convince them it was idiotic and failed. Format switches from
double to triple elimination, is designed to have repeat games, even on the same
day, and it simply silly. I understand the point -it protects from a specific
instance of bad seeding - but it is solving a problem that likely doesn't exist.
I will field this one.
The UPA is at the cutting edge of tournament
formatting. Some tournaments do have losers' brackets
but those are for sports where underdogs have a
fighting chance in any game and the format is designed
to pick a winner, not to sort out places 2-N.
Generally, few other sports care about picking
non-winners, simply calling the finals loser the 2nd
place team, the semis losers joint 3-4, etc., and if
they have a need to pick only 3, say, they will
declare the team that lost to the eventual winner to
be the 3rd place team. In a case like that, since the
semis are generally 1-4 and 2-3, the 4th seed would be
the most likely one to finish 3rd.
Now, onto the 16.3.1 format, the modified triple-elim
to pick three teams. Yeah, it's screwy, since the
most likely scenario is that 3 beats 4 in the backdoor
"final", loses to 2 in the 2nd place game while 4
beats 5 again (which had just beat 6), then 3 plays 4
again for 3rd. But, you know, it's easy to come up
with scenarios where N did not play N+1 and just
happened to lose to the same teams in a slightly
different order because of the seeding (which might
even be a fair seeding).
And it's always to a team's advantage to win a round,
even if the most likely scenario is that they'll lose
next round and have a rematch.
The problem, of course, is that the format thinks that
if A beats B once, it will always beat B, when that
doesn't happen all the time, and people are
uncomfortable when B beats A in the rematch, and angry
when A beats B for a second time in three rounds.
How's that?
--
And he irately responded:
A format that expects rematches is a bad one. I think what happened at
college regionals a few years back is a good example. Basically a bunch of
teams played each other twice and they all split. Umass lost to brown by a
point in the finals, a guy broke his leg, then went on to lose 2 more games
and be knocked out. More interesting, I think Dartmouth lost to Harvard ten
beat Harvard, same with Dartmouth Williams or something, certainly with
Dartmouth umass. It leaves a very bad taste to have to play a team twice, as a
matter of course, not some screwy 15 beats 2 scenario, and have them split,
and make the winner of the 2nd game the victor. If you want teams to play
multiple times, make it 3 and have it be a best of 3. the way it sits,
there will be multiple rematches, and likely multiple splits. I realize we
are unique in having to pick seeds 1-3 and not just 1-2, but there is a
limit to "fairness", especially when it introduces more "unfairness".
Bunch of tree-hugging wussie liberals, if you lose you don't get a
rematch just bc its nice.
Can you ask some UPA type this question: "What other sport uses the UPAs 16.3.1
format?" ..you know, the one in which you have to beat everyone twice. I all
tried to convince them it was idiotic and failed. Format switches from
double to triple elimination, is designed to have repeat games, even on the same
day, and it simply silly. I understand the point -it protects from a specific
instance of bad seeding - but it is solving a problem that likely doesn't exist.
I will field this one.
The UPA is at the cutting edge of tournament
formatting. Some tournaments do have losers' brackets
but those are for sports where underdogs have a
fighting chance in any game and the format is designed
to pick a winner, not to sort out places 2-N.
Generally, few other sports care about picking
non-winners, simply calling the finals loser the 2nd
place team, the semis losers joint 3-4, etc., and if
they have a need to pick only 3, say, they will
declare the team that lost to the eventual winner to
be the 3rd place team. In a case like that, since the
semis are generally 1-4 and 2-3, the 4th seed would be
the most likely one to finish 3rd.
Now, onto the 16.3.1 format, the modified triple-elim
to pick three teams. Yeah, it's screwy, since the
most likely scenario is that 3 beats 4 in the backdoor
"final", loses to 2 in the 2nd place game while 4
beats 5 again (which had just beat 6), then 3 plays 4
again for 3rd. But, you know, it's easy to come up
with scenarios where N did not play N+1 and just
happened to lose to the same teams in a slightly
different order because of the seeding (which might
even be a fair seeding).
And it's always to a team's advantage to win a round,
even if the most likely scenario is that they'll lose
next round and have a rematch.
The problem, of course, is that the format thinks that
if A beats B once, it will always beat B, when that
doesn't happen all the time, and people are
uncomfortable when B beats A in the rematch, and angry
when A beats B for a second time in three rounds.
How's that?
--
And he irately responded:
A format that expects rematches is a bad one. I think what happened at
college regionals a few years back is a good example. Basically a bunch of
teams played each other twice and they all split. Umass lost to brown by a
point in the finals, a guy broke his leg, then went on to lose 2 more games
and be knocked out. More interesting, I think Dartmouth lost to Harvard ten
beat Harvard, same with Dartmouth Williams or something, certainly with
Dartmouth umass. It leaves a very bad taste to have to play a team twice, as a
matter of course, not some screwy 15 beats 2 scenario, and have them split,
and make the winner of the 2nd game the victor. If you want teams to play
multiple times, make it 3 and have it be a best of 3. the way it sits,
there will be multiple rematches, and likely multiple splits. I realize we
are unique in having to pick seeds 1-3 and not just 1-2, but there is a
limit to "fairness", especially when it introduces more "unfairness".
Bunch of tree-hugging wussie liberals, if you lose you don't get a
rematch just bc its nice.
Wednesday, August 23, 2006
Randomness vs out of control
In ultimate, you occasionally see great upsets, games with few turnovers, and runs of 3 or 4 breaks in a row against a good offense. Now imagine a Strat-o-Matic Ultimate game. You would still see great upsets, games with few turnovers, and runs of 3 or 4 breaks in a row against a good offense. This article either does or does not say (I can’t figure it out) that the frequency of these things in Strat-o-Matic Ultimate is no different from the frequency in real ultimate.
This says to me (if it does say anything) that it’s probably folly to use a goal/no goal system to determine if you’re playing unnaturally well or badly. The human mind is terrific at finding patterns, but sometimes it finds patterns that aren’t really there. “Uhoh, tails came up twice in a row, better change the coin.” If you perceive a pattern that isn’t there, you may end up switching to a suboptimal strategy or set of personnel.
This is where your “scouts” are useful. Sometimes experienced eyes can tell whether a run is due to bad play or bad luck. It’s harder still to know whether a good run is due to play or luck, since a bad run forces you to consider making a change, while a good run is just business as usual, or so you think. Experienced eyes will go beyond just whether you scored or not and will look at the constituents of the point. Did we force any high stall counts? Were there any near-blocks? How many first options did we shut down? For the offense, did we make any bad throw choices that came out well? Were we clogging? Are we moving the disc? Did we just take good shots that didn't work out?
But these are hard to tell. If you were to ask me how our offense is doing, I would probably take how I felt out there and project it to the squad, with perhaps an observation or two about some non-turnover-causing mistake I witnessed (e.g., so-and-so cut me off so we’re not creating space well). It’s not that I’m being petty about it, but that’s the world I’m seeing for those 12 seconds of offense.
Who has better ideas of what to focus on? Anyone have any cues to focus on?
This says to me (if it does say anything) that it’s probably folly to use a goal/no goal system to determine if you’re playing unnaturally well or badly. The human mind is terrific at finding patterns, but sometimes it finds patterns that aren’t really there. “Uhoh, tails came up twice in a row, better change the coin.” If you perceive a pattern that isn’t there, you may end up switching to a suboptimal strategy or set of personnel.
This is where your “scouts” are useful. Sometimes experienced eyes can tell whether a run is due to bad play or bad luck. It’s harder still to know whether a good run is due to play or luck, since a bad run forces you to consider making a change, while a good run is just business as usual, or so you think. Experienced eyes will go beyond just whether you scored or not and will look at the constituents of the point. Did we force any high stall counts? Were there any near-blocks? How many first options did we shut down? For the offense, did we make any bad throw choices that came out well? Were we clogging? Are we moving the disc? Did we just take good shots that didn't work out?
But these are hard to tell. If you were to ask me how our offense is doing, I would probably take how I felt out there and project it to the squad, with perhaps an observation or two about some non-turnover-causing mistake I witnessed (e.g., so-and-so cut me off so we’re not creating space well). It’s not that I’m being petty about it, but that’s the world I’m seeing for those 12 seconds of offense.
Who has better ideas of what to focus on? Anyone have any cues to focus on?
Monday, July 24, 2006
Value of a puller (warning: numbers)
What is the value of a good puller? George said he thought one of his teammates was worth 4-5 goals a game based on his pulls, but I think that a player worth 4-5 goals on defense would be the best defensive player on the planet.
So how do you go about estimating this? One way is to start by looking at breaks. Elite Open teams probably average only about 4 breaks a game against other elite teams. Splitting the credit among the 7 guys who play defense, this means each guy is only worth maybe 0.5 goal a game over an inflatable dummy. If a team averages 7-8 breaks a game (which would mean that they are more likely to score than the receiving team), then either that team is phenomenal or else (more likely) the playing environment (either bad weather or poor disc skills) means that even bad defense will get 3-4 breaks a game.
Or look at it on a point-by-point basis. Suppose that the odds of the O scoring the point (not the possession are 80% on a brick, 70% on an average/decent pull (lands in end zone, one free pass), and 60% on a terrific pull (lands in end zone and hangs long enough for D to contest first pass). 80% scoring rate would translate to 3 breaks in 15 opportunities (game to 15), 70% = 4.5 breaks, 60% = 6 breaks. A perfect puller would only be worth 3 breaks over the worst puller, and just 1.5 breaks over someone who just threw line drives into the end zone. Factor in that the perfect puller doesn’t exist (although the little guy on Bravo came awfully close when we played them at the Colorado Cup) and you are probably looking at about a 1 goal per game difference between a great puller and the average puller. (Keep in mind that the “average puller” is still better than “how the average player would pull.” Any defensive squad probably has 2-3 “average pullers”.) Now, this is quite valuable, as we showed above that a good defensive player might be worth only 0.5 goals a game over a field cone, but it’s not 4-5 goals a game.
Or consider a less efficient environment, where the O holds serve 60%, 50%, and 40% of the time on the three pulls. The team with the perfect puller would now get 9 breaks a game, but the team with the bad puller would get 6, leaving the same “value over replacement”.
You could probably do a similar exercise with O players and come up with the statement that a good O player is only worth a goal a game over a replacement. Let’s do it for fun. We’ll put the D team out there on O receiving the pull. They’ll still score, say, 60% of the time (6 breaks a game). Our great O team of great O players scores 95% of the time (0.75 breaks a game). That’s 5.25 breaks/7 players = 0.75 breaks/game/player. Maybe the best player is worth 2 and the others are worth 1.25, .75, .5, .5, and 0.25.
And going back to the kid’s observation in George’s blog, not to pick on him, but the official UPA writeup tells a different story. Wisconsin got only two breaks, at 8-6 and 9-8 (the writer makes an error by saying the break at 9-8 was their second straight), and their D forced turnovers throughout the game but were unable to convert.
So how do you go about estimating this? One way is to start by looking at breaks. Elite Open teams probably average only about 4 breaks a game against other elite teams. Splitting the credit among the 7 guys who play defense, this means each guy is only worth maybe 0.5 goal a game over an inflatable dummy. If a team averages 7-8 breaks a game (which would mean that they are more likely to score than the receiving team), then either that team is phenomenal or else (more likely) the playing environment (either bad weather or poor disc skills) means that even bad defense will get 3-4 breaks a game.
Or look at it on a point-by-point basis. Suppose that the odds of the O scoring the point (not the possession are 80% on a brick, 70% on an average/decent pull (lands in end zone, one free pass), and 60% on a terrific pull (lands in end zone and hangs long enough for D to contest first pass). 80% scoring rate would translate to 3 breaks in 15 opportunities (game to 15), 70% = 4.5 breaks, 60% = 6 breaks. A perfect puller would only be worth 3 breaks over the worst puller, and just 1.5 breaks over someone who just threw line drives into the end zone. Factor in that the perfect puller doesn’t exist (although the little guy on Bravo came awfully close when we played them at the Colorado Cup) and you are probably looking at about a 1 goal per game difference between a great puller and the average puller. (Keep in mind that the “average puller” is still better than “how the average player would pull.” Any defensive squad probably has 2-3 “average pullers”.) Now, this is quite valuable, as we showed above that a good defensive player might be worth only 0.5 goals a game over a field cone, but it’s not 4-5 goals a game.
Or consider a less efficient environment, where the O holds serve 60%, 50%, and 40% of the time on the three pulls. The team with the perfect puller would now get 9 breaks a game, but the team with the bad puller would get 6, leaving the same “value over replacement”.
You could probably do a similar exercise with O players and come up with the statement that a good O player is only worth a goal a game over a replacement. Let’s do it for fun. We’ll put the D team out there on O receiving the pull. They’ll still score, say, 60% of the time (6 breaks a game). Our great O team of great O players scores 95% of the time (0.75 breaks a game). That’s 5.25 breaks/7 players = 0.75 breaks/game/player. Maybe the best player is worth 2 and the others are worth 1.25, .75, .5, .5, and 0.25.
And going back to the kid’s observation in George’s blog, not to pick on him, but the official UPA writeup tells a different story. Wisconsin got only two breaks, at 8-6 and 9-8 (the writer makes an error by saying the break at 9-8 was their second straight), and their D forced turnovers throughout the game but were unable to convert.
Thursday, April 27, 2006
more discussion on traveling
There is a thread on rsd about a clip of the day on ultivillage about whether a throw is a travel.
There is another factor at work here in determining the callability of the travel. I am distinguishing callability from legality here.
What makes a violation likely to be called? Two that spring to mind are:
1. Egregious violation
2. Clear advantage
2a. Breaking the mark
2b. Getting power on a huck
Some will argue about whether 2b is worthy of a travel call or not, and I'm not going to get into that today. But I read the commentary here, then I watched the clip, and came up with another factor:
3. Violator makes no attempt to avoid the infraction.
A defender who appears to try to avoid contact on a layout is less likely to be called for a foul than one who does not, even if the contact is the same. In this case, the hucker doesn't even seem to pay attention to his back foot. He just lets his back foot slide. It didn't drag, and it didn't simply roll over to his toe because he was exerting effort to keep it down and he made a powerful throw. A spectator or player who sees this play might intuitively feel that it's a travel not because he can actually tell that the foot moved before release, but because the thrower did nothing to prevent a travel.
I've made a few petty travel calls in my life, and have been irritated quite a few times by small travels, and I think those were due to factor #3 here. An example is the "handler hop" you'll sometimes see where a handler will catch a swing pass flat-footed and will take a little hop-step to the continue side. Beau's travels might fall under this category, too, as he walks back and forth about the same spot but isn't really setting himself up for anything.
Frank H might be on track with his belief that the soft love policies of ultimate that have allowed these routine, no-need violations to go unpunished have resulted in a less fundamentally sound game. But that, too, is a discussion for another day.
There is another factor at work here in determining the callability of the travel. I am distinguishing callability from legality here.
What makes a violation likely to be called? Two that spring to mind are:
1. Egregious violation
2. Clear advantage
2a. Breaking the mark
2b. Getting power on a huck
Some will argue about whether 2b is worthy of a travel call or not, and I'm not going to get into that today. But I read the commentary here, then I watched the clip, and came up with another factor:
3. Violator makes no attempt to avoid the infraction.
A defender who appears to try to avoid contact on a layout is less likely to be called for a foul than one who does not, even if the contact is the same. In this case, the hucker doesn't even seem to pay attention to his back foot. He just lets his back foot slide. It didn't drag, and it didn't simply roll over to his toe because he was exerting effort to keep it down and he made a powerful throw. A spectator or player who sees this play might intuitively feel that it's a travel not because he can actually tell that the foot moved before release, but because the thrower did nothing to prevent a travel.
I've made a few petty travel calls in my life, and have been irritated quite a few times by small travels, and I think those were due to factor #3 here. An example is the "handler hop" you'll sometimes see where a handler will catch a swing pass flat-footed and will take a little hop-step to the continue side. Beau's travels might fall under this category, too, as he walks back and forth about the same spot but isn't really setting himself up for anything.
Frank H might be on track with his belief that the soft love policies of ultimate that have allowed these routine, no-need violations to go unpunished have resulted in a less fundamentally sound game. But that, too, is a discussion for another day.
Friday, January 20, 2006
what's good about stats
From "CMMI: Guidelines for Process Integration and Product Improvement" by Chrissis, Konrad, and Shrum (btw, I would not recommend to ANYONE that they read this unless they have to):
"The purpose of Measurement and Analysis (MA) is to develop and sustain a measurement capability that is used to support management information needs....
Specifying the objectives of M&A such that they are aligned with identified information needs and objectives...
Providing objective results that can be used in making informed decisions, and taking appropriate corrective actions."
Translation: take measurements of something useful that you can do something about.
The best parts about stats are that they're objective and can be used to aid in decision-making, both individual (making better choices with the disc) and team (allocating playing time or determining strategies).
The easiest way to improve with stats is to identify strong negatives (or to use them to prove their existence to doubters). Player A is 1 for 10 on his hucks. Player B throws away 2 break marks a game. The team has not forced a break when playing zone D all year. These things will stand out on their own without any additional analysis needed. The corrective action will require some analysis, but you know that you have a problem. For Player A, you need to decide whether to improve his throws, tweak his decisions, or get him to stop hucking.
The next thing to do is to establish baselines, which won't be the same for everyone, owing to skill level, role, and reward-level of their throws. 88% completion might be borderline acceptable for an aggressive thrower who racks up a lot of goals and big yards, but cause for action for someone who only dumps it or who takes risky but not useful throws.
Now, at this point I'm not expecting anyone to actually establish numerical baselines. Besides being too much work, there are probably too many other confounders that your limits wouldn't be legitimate. But you can, as a captain or coach or even as an individual, establish goals for each player. Be aware, though, that a player might overcompensate on the risk/reward decision in order to improve that completion percentage. (In the earlier stat entry, gambler asked whether anyone played to the stats by making suboptimal decisions. I commented at the time that stat-padding (going for fantasy league stats instead of smart, solid play) was limited to blowout games, but I neglected the other side of suboptimal play.)
Maybe the largest benefit of stat-keeping as we know it is that it forces introspection. Although a player may deceive himself, he is also the one who is most aware of each of his plays. Stats can force a player to look at each of his miscues and reevaluate whether he made a good decision.
Finally, recognize that a Holy Grail of stats is not going to be available for a long time. There will not be any reliable way to roll up all of a player's offensive contributions into a single number. Accept this, and accept that any stat you keep is going to be just one aspect of production that is linked to the other aspects, and you might just find that you can learn something.
"The purpose of Measurement and Analysis (MA) is to develop and sustain a measurement capability that is used to support management information needs....
Specifying the objectives of M&A such that they are aligned with identified information needs and objectives...
Providing objective results that can be used in making informed decisions, and taking appropriate corrective actions."
Translation: take measurements of something useful that you can do something about.
The best parts about stats are that they're objective and can be used to aid in decision-making, both individual (making better choices with the disc) and team (allocating playing time or determining strategies).
The easiest way to improve with stats is to identify strong negatives (or to use them to prove their existence to doubters). Player A is 1 for 10 on his hucks. Player B throws away 2 break marks a game. The team has not forced a break when playing zone D all year. These things will stand out on their own without any additional analysis needed. The corrective action will require some analysis, but you know that you have a problem. For Player A, you need to decide whether to improve his throws, tweak his decisions, or get him to stop hucking.
The next thing to do is to establish baselines, which won't be the same for everyone, owing to skill level, role, and reward-level of their throws. 88% completion might be borderline acceptable for an aggressive thrower who racks up a lot of goals and big yards, but cause for action for someone who only dumps it or who takes risky but not useful throws.
Now, at this point I'm not expecting anyone to actually establish numerical baselines. Besides being too much work, there are probably too many other confounders that your limits wouldn't be legitimate. But you can, as a captain or coach or even as an individual, establish goals for each player. Be aware, though, that a player might overcompensate on the risk/reward decision in order to improve that completion percentage. (In the earlier stat entry, gambler asked whether anyone played to the stats by making suboptimal decisions. I commented at the time that stat-padding (going for fantasy league stats instead of smart, solid play) was limited to blowout games, but I neglected the other side of suboptimal play.)
Maybe the largest benefit of stat-keeping as we know it is that it forces introspection. Although a player may deceive himself, he is also the one who is most aware of each of his plays. Stats can force a player to look at each of his miscues and reevaluate whether he made a good decision.
Finally, recognize that a Holy Grail of stats is not going to be available for a long time. There will not be any reliable way to roll up all of a player's offensive contributions into a single number. Accept this, and accept that any stat you keep is going to be just one aspect of production that is linked to the other aspects, and you might just find that you can learn something.
Thursday, January 12, 2006
The perils of stats
I love stats, and always have. When I was 5, I would quiz my mom about stats from the backs of baseball cards. I kept track of Little League stats, wrestling records, golf scores, everything. And in ultimate, I have a record of every tournament since 1992 (and the game scores for those first few years, too). Whenever I have a chance, I've taken individual stats from videos, and was part of a team that recorded every pass back in 1991.
But sometimes I wonder what it's all for. There are a few problems with stats that might just overwhelm their usefulness.
1. Small sample sizes.
2. Other things being equal, ....
3. Field position.
4. False normalization.
The first one is a bane for all sports. You'll hear "so and so is 2 for 18 against this pitcher." This has almost no value in predicting the outcome of their next encounter. Even if you have 100 passes, there is still some chance that a 90% passer will outperform a 95% passer. A lot of studies have shown that the "hot hand" is mostly just a figment of the beholder's imagination.
The problem with the second one is that they're usually not. 3 for 3 is better than 2 for 3, if the passes are the same length, but if the first passer completes dumps that put the disc on a trapped line while the second passer attempts upwind hucks, the second one is more useful. Over time, some of these things wash out, but there will still be outstanding differences resulting from usage patterns. The ideal solution is to compartmentalize the stats as much as possible, so that you separate hucks from dumps, O points from D points, zone from man, strong opponents from weak opponents, but then you get back into problem #1.
Field position (and wind) is just a subset. 40% scoring efficiency might be great if you're starting from your own goal line going upwind, but horrible when starting in the red zone.
False normalization results from the zero-sum aspect of the game. Baseball fielding has a similar problem, in that no matter how bad your defense, you still produce 27 outs in a game. You'll get 15 goals if you win no matter how bad your opponent or how bad you play. Sure, you'll have turnovers, just as you have errors or "defensive efficiency" (percentage of batted balls turned into outs) in baseball, but it makes it impossible to compare players on different teams. Having good teammates will actually hurt your raw stats in either ultimate or baseball (for fielding; batting stats will improve) because you'll have fewer opportunities for yourself.
What to do about this? I'm not sure. It's a bit of a problem, since we need to have a large sample from all levels in order to come up with a good model of how the game works, but no one wants to put in all the effort if they won't be able to do any actionable analysis immediately. But if nobody does anything, then all we're left with is conventional wisdom about what the smart move is in a given situation.
I'd like to see more situational analysis, measuring tradeoffs. For instance, if you have a 20% chance at pulling it OB, is it worth the risk of trying to land it within 10 yards of the sideline? How effective are set plays? What's the difference between having the disc on the line vs in the middle of the field? &c.
But sometimes I wonder what it's all for. There are a few problems with stats that might just overwhelm their usefulness.
1. Small sample sizes.
2. Other things being equal, ....
3. Field position.
4. False normalization.
The first one is a bane for all sports. You'll hear "so and so is 2 for 18 against this pitcher." This has almost no value in predicting the outcome of their next encounter. Even if you have 100 passes, there is still some chance that a 90% passer will outperform a 95% passer. A lot of studies have shown that the "hot hand" is mostly just a figment of the beholder's imagination.
The problem with the second one is that they're usually not. 3 for 3 is better than 2 for 3, if the passes are the same length, but if the first passer completes dumps that put the disc on a trapped line while the second passer attempts upwind hucks, the second one is more useful. Over time, some of these things wash out, but there will still be outstanding differences resulting from usage patterns. The ideal solution is to compartmentalize the stats as much as possible, so that you separate hucks from dumps, O points from D points, zone from man, strong opponents from weak opponents, but then you get back into problem #1.
Field position (and wind) is just a subset. 40% scoring efficiency might be great if you're starting from your own goal line going upwind, but horrible when starting in the red zone.
False normalization results from the zero-sum aspect of the game. Baseball fielding has a similar problem, in that no matter how bad your defense, you still produce 27 outs in a game. You'll get 15 goals if you win no matter how bad your opponent or how bad you play. Sure, you'll have turnovers, just as you have errors or "defensive efficiency" (percentage of batted balls turned into outs) in baseball, but it makes it impossible to compare players on different teams. Having good teammates will actually hurt your raw stats in either ultimate or baseball (for fielding; batting stats will improve) because you'll have fewer opportunities for yourself.
What to do about this? I'm not sure. It's a bit of a problem, since we need to have a large sample from all levels in order to come up with a good model of how the game works, but no one wants to put in all the effort if they won't be able to do any actionable analysis immediately. But if nobody does anything, then all we're left with is conventional wisdom about what the smart move is in a given situation.
I'd like to see more situational analysis, measuring tradeoffs. For instance, if you have a 20% chance at pulling it OB, is it worth the risk of trying to land it within 10 yards of the sideline? How effective are set plays? What's the difference between having the disc on the line vs in the middle of the field? &c.
Monday, December 19, 2005
Relative value of O and D
Here’s a paradox:
Is one of these assumptions in error? Which one(s)?
I’m going to go with the first assumption, and here’s why. The advanced view of “value” is “contribution above replacement level.” However, a lot of defense is simply showing up and not screwing up so badly that you hand away goals. A "replacement level" defense is still going to get turns, while a replacement level offense (especially in women's ultimate) is going to do really badly.
Let's just guess that in a decent game between decent teams, offenses score 50% of the time (and defenses get turnovers 50% of the time). In a blowout, say 15-5, the offense will still probably have maybe 10 turnovers, yielding a 60% efficiency against a replacement defense, meaning the other's team's (replacement) offense scores on only about 20% of their possessions. So, the average offense is (50% - 20%) better than a replacement offense, but an average defense is only (60% - 50%) better than a replacement defense.
Maybe this is what people are saying when they say defensive strategy is practically non-existent. Most of the value in playing defense is just being in position.
Part I of an ongoing thread on analysis of ultimate. (I don't really want to call it statisticial analysis because the numbers aren't the important thing, it's the concepts behind the numbers.)
- Offense and defense are equally important in ultimate.
- Most of the important players are important because of their offense.
- If you add up the individual values of all the players, the sum of the offensive guys will be more than that of the defensive guys. But see #1.
Is one of these assumptions in error? Which one(s)?
I’m going to go with the first assumption, and here’s why. The advanced view of “value” is “contribution above replacement level.” However, a lot of defense is simply showing up and not screwing up so badly that you hand away goals. A "replacement level" defense is still going to get turns, while a replacement level offense (especially in women's ultimate) is going to do really badly.
Let's just guess that in a decent game between decent teams, offenses score 50% of the time (and defenses get turnovers 50% of the time). In a blowout, say 15-5, the offense will still probably have maybe 10 turnovers, yielding a 60% efficiency against a replacement defense, meaning the other's team's (replacement) offense scores on only about 20% of their possessions. So, the average offense is (50% - 20%) better than a replacement offense, but an average defense is only (60% - 50%) better than a replacement defense.
Maybe this is what people are saying when they say defensive strategy is practically non-existent. Most of the value in playing defense is just being in position.
Part I of an ongoing thread on analysis of ultimate. (I don't really want to call it statisticial analysis because the numbers aren't the important thing, it's the concepts behind the numbers.)
Friday, November 11, 2005
How would you assess the quality of play?
This is a difficult task, and would be even if there were a lot of stats available. You would expect that in a growing, still-immature sport that the level of play would increase more or less continuously.
Another confounder is that we’re not sure if we’re talking about individuals or teams, and are we talking about the very best, or the not quite best, or the average? But I'm not going to go into that today.
Zaz talked about this in a different way in his Sept 9 post, “Big Time Sports” and why ultimate is still not ready for prime time.
The following are all indicators, not conclusive proof
At the cost of belaboring, I’ll explain why each of these is important. I should also caution that I wouldn’t use any of these to compare two individuals or two teams, since there is a lot of noise in the measurement and plenty of counter-examples, but when you have sample size on your side, you ought to be able to see a difference.
Ability of one player to dominate a game. Anthropologist Stephen Jay Gould wrote about this in an article about why there are no more .400 hitters in baseball. When there are more good players in the game, it’s harder for any one of them to rise above. Or look at Colorado’s Beau. He scored 9 goals in the finals of College Nationals. I barely remember his presence when we played them at Club Nationals.
The degree of specialization. The NFL used to have two-way players, and high schools still have a lot of them. Now, there are pass-rushing linebackers and pass-defending linebackers and nickel backs and dime backs and long snappers. Ultimate has more O and D lines now, and players who do only one thing well.
The ability of old and young players to play. If an 18 year old with a year of experience can be a factor at Nationals, no matter how athletic he may be, that says something about the quality of play in the sport. Same deal with a 40 year old, no matter how much he knows about the game. But countering this are a few factors. Players are starting earlier and getting instruction earlier, so 18 might be the new 22. On the other end, I don’t think it ever occurred to most 35 year olds that they should still be playing the game instead of having moved on to life. And for both ends, specialization allows them to contribute what they can without having their weaknesses exploited too much.
The number of players under 5’8”. Short players can compensate for lack of height with quickness, but real athletes are big and quick and would force the little guy out of the game.
The number of errors (turnovers) and the % that are unforced. But an increase in offensive effectiveness could be countered by an increase in defensive effectiveness, leaving the efficiency unchanged. Additionally, a change in the way the rules are enforced (stricter calling of travels, more hacking on the mark) could change the offense/defense balance without being a comment on the skill level. (And let’s not forget the random effects of wind.) You could instead count unforced errors. “Drops” would probably be a good easy-to-track stat. But many “unforced errors” are just good defense, and many “blocks” are just bad throws, so I don’t think you could easily track this. Perhaps “average stall count on turnovers” would be a surrogate. Anyway, having said all this, fewer turnovers generally implies a higher level of play.
The ability to score upwind and the ability to move the length of the field. This seems like an obvious one, but there might actually be limited stats on this. I’m embarrassed for the Open division remembering the DoG/Condors pool play game of 1998 and the Condors/Jam final of 2001 because there were so few upwinders while other divisions had them playing at the same time or on the same field. If “huck it and play zone” is your strategy, that’s a sign of a low level of play (or a 30 mph wind).
The average margin of victory. This could be a measure of parity as much as it is a measure of quality, but more blowouts means that the overall level of play isn’t as high. Little League teams might win one game 18-0 and lose the next 22-2.
The number of ultimate players. More players should equal more good players and more good teams and better top-level teams. But we’d also need to figure out where those players are playing. If we assume no change to the skill of the population but we have twice as many players drawn from that population, we’d have twice as many good players. Are they being spread out to the same number of good teams, or are there twice as many good teams now?
The extent of coaches. Also, the average age of the team captains.
The number of youth programs. This is probably more of a leading indicator, by 5 or 10 years, as it will take some time for these players to develop.
The amount of written instructional material. When everyone has to reinvent the wheel each time, you can’t progress.
The sophistication of playbooks and strategies. If all you’re doing is hucking it and playing zone if it’s not complete, chances are that the level of play isn’t that high.
Another confounder is that we’re not sure if we’re talking about individuals or teams, and are we talking about the very best, or the not quite best, or the average? But I'm not going to go into that today.
Zaz talked about this in a different way in his Sept 9 post, “Big Time Sports” and why ultimate is still not ready for prime time.
The following are all indicators, not conclusive proof
- Ability of one player to dominate a game
- The degree of specialization
- The ability of old and young players to play
- The number of players under 5’8”
- The number of errors (turnovers)
- Percentage of turnovers that are unforced
- The ability to score upwind
- The ability to move the length of the field
- The average margin of victory
- The number of ultimate players
- The extent of coaches
- The number of youth programs
- The amount of written instructional material
- The sophistication of playbooks and strategies
At the cost of belaboring, I’ll explain why each of these is important. I should also caution that I wouldn’t use any of these to compare two individuals or two teams, since there is a lot of noise in the measurement and plenty of counter-examples, but when you have sample size on your side, you ought to be able to see a difference.
Ability of one player to dominate a game. Anthropologist Stephen Jay Gould wrote about this in an article about why there are no more .400 hitters in baseball. When there are more good players in the game, it’s harder for any one of them to rise above. Or look at Colorado’s Beau. He scored 9 goals in the finals of College Nationals. I barely remember his presence when we played them at Club Nationals.
The degree of specialization. The NFL used to have two-way players, and high schools still have a lot of them. Now, there are pass-rushing linebackers and pass-defending linebackers and nickel backs and dime backs and long snappers. Ultimate has more O and D lines now, and players who do only one thing well.
The ability of old and young players to play. If an 18 year old with a year of experience can be a factor at Nationals, no matter how athletic he may be, that says something about the quality of play in the sport. Same deal with a 40 year old, no matter how much he knows about the game. But countering this are a few factors. Players are starting earlier and getting instruction earlier, so 18 might be the new 22. On the other end, I don’t think it ever occurred to most 35 year olds that they should still be playing the game instead of having moved on to life. And for both ends, specialization allows them to contribute what they can without having their weaknesses exploited too much.
The number of players under 5’8”. Short players can compensate for lack of height with quickness, but real athletes are big and quick and would force the little guy out of the game.
The number of errors (turnovers) and the % that are unforced. But an increase in offensive effectiveness could be countered by an increase in defensive effectiveness, leaving the efficiency unchanged. Additionally, a change in the way the rules are enforced (stricter calling of travels, more hacking on the mark) could change the offense/defense balance without being a comment on the skill level. (And let’s not forget the random effects of wind.) You could instead count unforced errors. “Drops” would probably be a good easy-to-track stat. But many “unforced errors” are just good defense, and many “blocks” are just bad throws, so I don’t think you could easily track this. Perhaps “average stall count on turnovers” would be a surrogate. Anyway, having said all this, fewer turnovers generally implies a higher level of play.
The ability to score upwind and the ability to move the length of the field. This seems like an obvious one, but there might actually be limited stats on this. I’m embarrassed for the Open division remembering the DoG/Condors pool play game of 1998 and the Condors/Jam final of 2001 because there were so few upwinders while other divisions had them playing at the same time or on the same field. If “huck it and play zone” is your strategy, that’s a sign of a low level of play (or a 30 mph wind).
The average margin of victory. This could be a measure of parity as much as it is a measure of quality, but more blowouts means that the overall level of play isn’t as high. Little League teams might win one game 18-0 and lose the next 22-2.
The number of ultimate players. More players should equal more good players and more good teams and better top-level teams. But we’d also need to figure out where those players are playing. If we assume no change to the skill of the population but we have twice as many players drawn from that population, we’d have twice as many good players. Are they being spread out to the same number of good teams, or are there twice as many good teams now?
The extent of coaches. Also, the average age of the team captains.
The number of youth programs. This is probably more of a leading indicator, by 5 or 10 years, as it will take some time for these players to develop.
The amount of written instructional material. When everyone has to reinvent the wheel each time, you can’t progress.
The sophistication of playbooks and strategies. If all you’re doing is hucking it and playing zone if it’s not complete, chances are that the level of play isn’t that high.
Wednesday, October 19, 2005
fun with RRI
I took the RRI for pool A (my pool) and added some variability to see how the pool might play out. First, the expectations:
RRI:
FG 2636
DoG 2610
CL 2563
PBR 2459
Scores:
FG 15 DoG 14.3
FG 15 CL 13.1
FG 15 PBR 10.5
DoG 15 CL 13.8
DoG 15 PBR 11.1
CL 15 PBR 12.3
Next, I assumed that there was a 100 point standard deviation in what the true RRI was for a team, and that there was a 100 point sd for a game between any two teams (implying each team has a 71 point sd). Is that the right amount of variability? Too much? Too little? I don't know. It's probably too much, I guess. Over the range we're dealing with, there is a linear relationship of about 39 points of RRI for 1 point in a game to 15.
Then I ran the pool 30 times. The results:
PP% is % making it to the power pools.
Finish 1 2 3 4 PP%
FG 13 11 5 1 80%
DoG 12 9 7 2 70%
CL 5 8 12 5 43%
PBR 0 2 6 22 7%
Oddly, there wasn't a single three-way tie for 1st in the run, and only two occasions where there was a two-way tie (one of the teams lost to PBR). It took another 10 runs for a three-way tie for 1st, although PBR was involved. It wasn't until run #53 that Chain won the three-way due to a 15-9.7 win over FG.
PBR finally won the pool in run #36, eking out 2 1-pointers and a 2-pointer, while Furious turned out to be a lot worse than anyone thought (true RRI of 2363 instead of 2636; maybe there were a lot of visa problems or the flight with MG/Shank/Drew got cancelled).
I'm tempted to run the full tournament, but the tiebreakers and crossovers are just a little too conditional to do it simply.
RRI:
FG 2636
DoG 2610
CL 2563
PBR 2459
Scores:
FG 15 DoG 14.3
FG 15 CL 13.1
FG 15 PBR 10.5
DoG 15 CL 13.8
DoG 15 PBR 11.1
CL 15 PBR 12.3
Next, I assumed that there was a 100 point standard deviation in what the true RRI was for a team, and that there was a 100 point sd for a game between any two teams (implying each team has a 71 point sd). Is that the right amount of variability? Too much? Too little? I don't know. It's probably too much, I guess. Over the range we're dealing with, there is a linear relationship of about 39 points of RRI for 1 point in a game to 15.
Then I ran the pool 30 times. The results:
PP% is % making it to the power pools.
Finish 1 2 3 4 PP%
FG 13 11 5 1 80%
DoG 12 9 7 2 70%
CL 5 8 12 5 43%
PBR 0 2 6 22 7%
Oddly, there wasn't a single three-way tie for 1st in the run, and only two occasions where there was a two-way tie (one of the teams lost to PBR). It took another 10 runs for a three-way tie for 1st, although PBR was involved. It wasn't until run #53 that Chain won the three-way due to a 15-9.7 win over FG.
PBR finally won the pool in run #36, eking out 2 1-pointers and a 2-pointer, while Furious turned out to be a lot worse than anyone thought (true RRI of 2363 instead of 2636; maybe there were a lot of visa problems or the flight with MG/Shank/Drew got cancelled).
I'm tempted to run the full tournament, but the tiebreakers and crossovers are just a little too conditional to do it simply.
Thursday, August 25, 2005
world games stats, analysis
Hartti Suomela has some analysis over on his blog. I've been laying low on this front.
Next up for me is a review of my history in summer league and some comments on the state of summer league.
Next up for me is a review of my history in summer league and some comments on the state of summer league.
Friday, July 22, 2005
World Games stats
Source: Rosters at http://ressourcen.wige-data.de/infosystem/?lang=en&sport_id=16. Germany and Finland list women first. Japan and Canada list men first. US and Australia integrate.
Scores and goal scoring at http://www.wfdf.org/wg2005/scores.htm.
Day 1 completed: Men 1188 goals caught, 156 goals thrown. Women 69 goals caught, 30 goals thrown. (Note: I think this is a 4M/3W game, as rosters are 6M/5F.)
US is about average, with 28% of GC and 18% of GT done by women. Japan is worst, with only 5 GC and 3 GT by women. Totals (please scroll down):
Scores and goal scoring at http://www.wfdf.org/wg2005/scores.htm.
Day 1 completed: Men 1188 goals caught, 156 goals thrown. Women 69 goals caught, 30 goals thrown. (Note: I think this is a 4M/3W game, as rosters are 6M/5F.)
US is about average, with 28% of GC and 18% of GT done by women. Japan is worst, with only 5 GC and 3 GT by women. Totals (please scroll down):
| Team | M-GC | M-GT | W-GC | W-GT | Total | %W-GC | %W-GT |
| US | 28 | 32 | 11 | 7 | 23% | 28% | 18% |
| Canada | 17 | 28 | 16 | 4 | 31% | 48% | 13% |
| Austr | 25 | 32 | 12 | 7 | 25% | 32% | 18% |
| Japan | 21 | 23 | 5 | 3 | 15% | 19% | 12% |
| Finland | 14 | 18 | 11 | 7 | 36% | 44% | 28% |
| Germany | 13 | 23 | 14 | 2 | 31% | 52% | 8% |
| Totals | 118 | 156 | 69 | 30 | 27% | 37% | 16% |
Thursday, June 30, 2005
efficiency curves
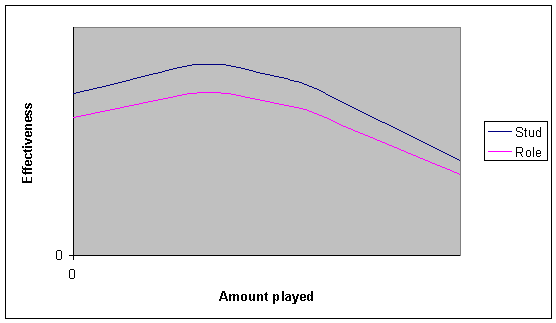

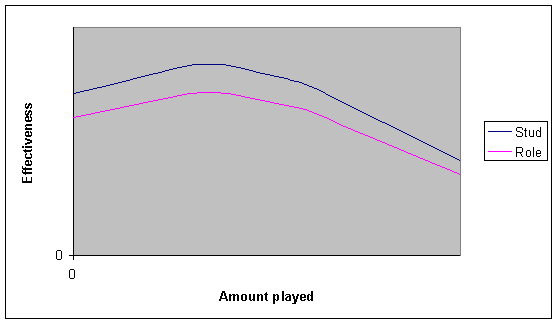
There are two “efficiency curves” that are relevant to playing time and role. One of them is how a player’s performance varies based on how much he’s put in. The other is how his performance varies based on how much he’s asked to do.
At the one extreme, it’s hard to be effective playing every 10th point. At the other, too much play leads to fatigue or pacing and a similar decrease in effectiveness. You want your team to be at a sweet spot where your stars play as much as they can without losing effectiveness while getting your role players enough time to be effective, while maintaining the flexibility to ride one or the other a little more due to a hot or cold hand or an injury.
The first graph shows what I’m guessing a typical curve is for a stud and a role player, and a replacement player. (You can think of the x axis as either “readiness” or “points played”.) I think the shape of the curve is about the same for everyone, with the exception that well-conditioned athletes won’t drop off as quickly with lots of play.
So, the question for subbers is, can you incorporate this model into your subbing scheme? How much does a player have to play in order to be near his peak effectiveness? How much is too much before you start to see fatigue-related errors? Have you experimented with designating some role players to “on” one game (maybe they’ll play 8 points) and “off” the next (0-2 points) instead of being half-on (5 points) for both? Do players rebel against this?
The other curve shows how a player can bear a load when he’s in. On offense, if a player’s full job was to cut for goals, he’d be more effective than if he also had to work the disc. On defense, a player might be able to prevent the third handler from doing a lot, but would be toasted by the star cutter.
A good role player will actually be better than the stud at the subordinate tasks like filling or clearing or reacting to the poach, but the reason that the stud is the stud is that he will be effective when it’s his job to be the first cutter or to break the mark or to cover the top cutter.
Anyway, I’m not really sure what you’re supposed to do with this, but I’ve been thinking about it and wanted to write it up, so there.
Tuesday, June 21, 2005
blowouts and upsets
Are there too many of these in ultimate? Are upsets so unlikely that most games are a given? A couple months ago, during the ever-so-boring winter, I took a look at the RRI for club teams for 2004 (rankings are no longer available on the UPA site since the 2005 season is going on). One nice feature of this Bradley-Terry model is that you can easily convert rankings to expected point differentials.
The next logical step is to convert point differentials into expected winning percentages. I want you to make a quick guess on the following problem. If the rankings predict a 15-12.5 victory, how often will the underdog actually win?
Baseball teams that outscore their opponents by that ratio will win about 59% of their games (96 wins in a 162 game season). NFL teams: 63% (10-6). Soccer teams: 55% (counting ties as half-wins). NBA: 94% (77-5). Ultimate: my brief, severely flawed study shows 65% for women's games and 85% for men's. An earlier brief, less-flawed study came up with an estimate of 67-75%. (The other estimates use a version of Bill James' Pythagorean Theorem, which says that the expected winning percentage is A^N/(A^N + B^N), with N=2 for baseball. Other sports' exponents: NFL 3, NBA 15, soccer 1.2, ultimate 4-6. If you had a sport where every game was 1-0, the exponent would be 1.)
I took all the games for the top 27 ranked teams in 2004, and grouped them according to the number of goals a lower-ranked team should score against them. For instance, where the score should be anywhere between 15-14.99 and 15-14, the higher-ranked men's teams were 59-34. (Incidentally, I think the one defeat for 15-7 men's teams was a mistake in the reported score.)
One major flaw is that this method uses actual results to predict those same results. Really, the rankings should be calculated ignoring each game, one at a time, and then using that. But here are the results:
Men Women
Spread W L W L
14 59 34 19 7
13 65 29 20 10
12 51 9 36 19
11 45 3 31 10
10 45 3 42 4
9 52 1 35 0
8 35 0 44 4
7 30 1 29 0
6 18 0 38 0
5 29 0 28 0
4 22 0 23 0
3 20 0 27 0
2 23 0 24 0
1 21 0 37 0
0 17 0 52 0
Couple other interesting things: women's game are much more likely to be expected blowouts (three times as many 15-0 matchups), and slight underdogs in women's games actually had a much better chance at victory than in men's. But maybe that second part is just an artifact of the ranking system, since the disparity in women's abilities are much greater and it messes with the rankings since you can't win any worse than 15-0. (The #1 women's team is expected to beat the #14 women's team 15-5, while that matchup for guys would be 15-10.3.)
Overall, about 45% of men's games and 60% of women's games were simply going through the motions to see what the final score was.
The next logical step is to convert point differentials into expected winning percentages. I want you to make a quick guess on the following problem. If the rankings predict a 15-12.5 victory, how often will the underdog actually win?
Baseball teams that outscore their opponents by that ratio will win about 59% of their games (96 wins in a 162 game season). NFL teams: 63% (10-6). Soccer teams: 55% (counting ties as half-wins). NBA: 94% (77-5). Ultimate: my brief, severely flawed study shows 65% for women's games and 85% for men's. An earlier brief, less-flawed study came up with an estimate of 67-75%. (The other estimates use a version of Bill James' Pythagorean Theorem, which says that the expected winning percentage is A^N/(A^N + B^N), with N=2 for baseball. Other sports' exponents: NFL 3, NBA 15, soccer 1.2, ultimate 4-6. If you had a sport where every game was 1-0, the exponent would be 1.)
I took all the games for the top 27 ranked teams in 2004, and grouped them according to the number of goals a lower-ranked team should score against them. For instance, where the score should be anywhere between 15-14.99 and 15-14, the higher-ranked men's teams were 59-34. (Incidentally, I think the one defeat for 15-7 men's teams was a mistake in the reported score.)
One major flaw is that this method uses actual results to predict those same results. Really, the rankings should be calculated ignoring each game, one at a time, and then using that. But here are the results:
Men Women
Spread W L W L
14 59 34 19 7
13 65 29 20 10
12 51 9 36 19
11 45 3 31 10
10 45 3 42 4
9 52 1 35 0
8 35 0 44 4
7 30 1 29 0
6 18 0 38 0
5 29 0 28 0
4 22 0 23 0
3 20 0 27 0
2 23 0 24 0
1 21 0 37 0
0 17 0 52 0
Couple other interesting things: women's game are much more likely to be expected blowouts (three times as many 15-0 matchups), and slight underdogs in women's games actually had a much better chance at victory than in men's. But maybe that second part is just an artifact of the ranking system, since the disparity in women's abilities are much greater and it messes with the rankings since you can't win any worse than 15-0. (The #1 women's team is expected to beat the #14 women's team 15-5, while that matchup for guys would be 15-10.3.)
Overall, about 45% of men's games and 60% of women's games were simply going through the motions to see what the final score was.
Subscribe to:
Posts (Atom)